Correction — September 1, 2026: the subtitle findings in this article have been withdrawn.
While re-running this study on a later sample we discovered that our iOS collector never captured the subtitle field at all — it is absent from every one of the 35,562 iOS listing snapshots we hold. The original figure, "61.2% of apps have no subtitle," therefore measured a gap in our own data collection rather than anything about the App Store. We have struck it, along with the average-subtitle-length figure and the subtitle change counts.
Correction completed September 10, 2026: the subtitle counts and recommendations have now also been removed from the table, FAQs and structured data. Title, description and release-note figures remain. The combined change-frequency distribution below describes the fields our collector recorded; because iOS subtitles were missing, it cannot establish how often complete listings changed. No new data has been collected for this correction.
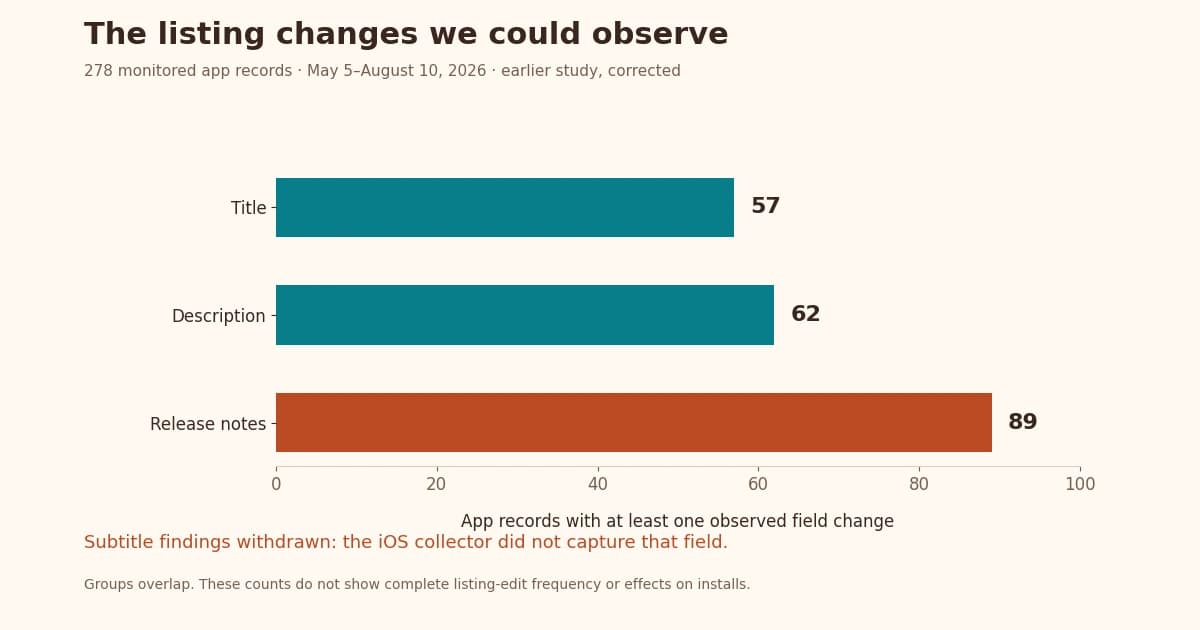
Quick answer: Across 26,972 listing snapshots of 278 apps monitored between May 5 and August 10, 2026, we recorded title changes for 57 apps, description changes for 62, and release-note changes for 89. Those counts describe our observation window, not a recommended editing schedule. Median per-app coverage was 23 days, and only 211 apps produced the successive observations needed to detect changes. The original subtitle findings have been withdrawn because our iOS collector did not capture that field.
We looked at which fields changed and how much history we had for each app. The results show editing activity during that window, but cannot tell you which schedule produces more installs. For per-field editing guidance, see our metadata optimization guide.
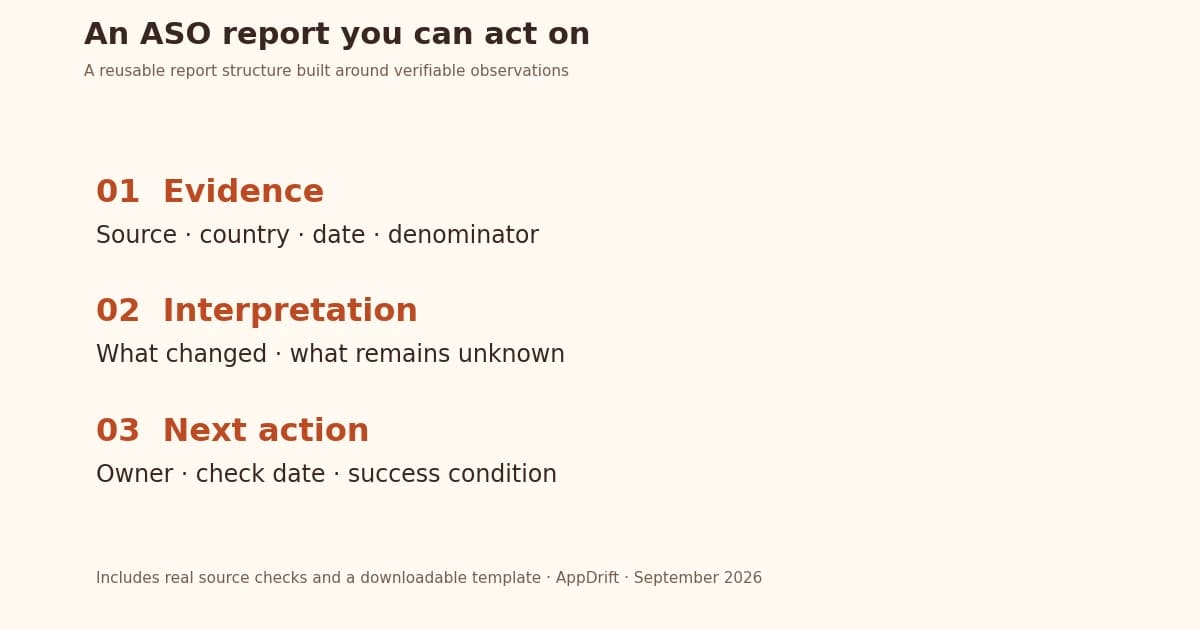
To keep a record of what you checked and which fields were unavailable, use the ASO report template. It keeps unavailable fields separate from observed zero values.
How often do apps actually update their App Store listing?
We observed fewer apps changing titles or descriptions than changing release notes. The original combined-field comparison also recorded no changes for 141 of the 202 apps with at least 14 days of coverage. That 69.8% is a no-detected-change rate in recorded fields, not a reliable estimate of how many complete listings stayed unchanged: an iOS subtitle edit would be invisible to this collector. Every figure below describes this corpus and its coverage, not the App Store as a whole.
How we measured this — and what this data can't tell you
Read the figures with these collection limits in mind.
Coverage is not what the window suggests. The full study spans 97 days, but most apps were monitored for much less time. These are 278 apps monitored across a 97-day window, with a median of 23 days of coverage each (mean 21.3 days). Ninety-six apps have 30 days or more; only three have 60 or more. An absence of detected changes therefore applies to a stretch that was typically about three weeks long. The combined-field distribution uses the 202 apps with at least two weeks of coverage. Change events were counted from the corpus's 20,816 successive-snapshot comparisons across 211 apps; snapshot and comparison totals should not be read as distinct app-days.
Missing data is not an empty field. The original comparison included a stored subtitle column, but the iOS collector never populated it. We cannot use that column to estimate subtitle usage, subtitle length or subtitle edit frequency. The combined-field distribution has not been recalculated as a title-and-description-only study. It remains a description of recorded-field comparisons, with incomplete subtitle coverage.
These are not the top apps. Every app here was added to AppDrift by its own owner to be monitored. The sample skews toward small, independent teams. It does not represent the App Store’s top charts.
The keyword field was not observed. In our public-listing corpus that column is empty for all 278 apps, so this study makes no claims about its contents or changes. Do not treat missing values as proof that owners left the field blank. Visible listing text and observed keyword ranks can support hypotheses about competitor targeting, but they do not reveal the private keyword field.
We measured edits, not consequences. We recorded listing changes without measuring their effect on rankings or installs. The separate rank studies also have collection limits; their missing observations cannot fill that gap.
Which fields did we observe changing?
Across all 278 monitored apps, here is how many had at least one recorded change in each usable field, and how many total change events we recorded. Only 211 apps produced successive observations from which changes could be detected. The denominator of 278 describes the full corpus; the remaining 67 apps cannot be classified as unchanged. Apps can appear in more than one row.
| Field | Apps with a detected change | Out of | Change events |
|---|---|---|---|
| Release notes | 89 | 278 | 358 |
| Description | 62 | 278 | 173 |
| Title | 57 | 278 | 158 |
| Subtitle | Withdrawn: iOS field not collected | — | — |
| Keyword field | not observable | — | — |
Release notes changed for more apps than either titles or descriptions. We cannot tell why from these snapshots: they record listing text, not binary releases. The counts also do not reveal how many developers changed only release notes, because the groups can overlap. There is no reliable subtitle comparison.
The original 70% figure: no detected changes in recorded fields
Here is the original combined-field distribution for the 202 apps with 14 or more days of coverage. It compares stored title, subtitle and description values. Because iOS subtitles were missing, this is not a distribution of complete listing edits and must not be quoted as "70% of apps never update their listing." We have retained the recorded counts with that limitation rather than invent a corrected result without rerunning the analysis.
Five apps had eight or more detected changes in this comparison. That tells us activity was uneven in the recorded data; it does not identify the editing schedules, experiments or intentions of those app owners. The 141 with no detected change may still have edited an uncollected subtitle, and we cannot see any app's changes before or after its monitoring window.
What the snapshots cannot establish about editing schedules
The original article interpreted short gaps between recorded change events as evidence that owners rewrite listings in bursts. That interpretation is removed. A recorded event is not necessarily a separate editing session, and the incomplete subtitle collection means we do not have a complete sequence of listing edits. This article therefore makes no claim about how frequently owners sit down to revise their listings.
What listings in this sample look like: 24 characters of title
Taking the most recent snapshot of each of the 278 apps, here is the shape of a typical listing in this corpus — again, small and owner-monitored apps, not top-charting ones:
| Measure | Value | Basis |
|---|---|---|
| Average title length | 24.1 chars | n = 278 apps |
| Average description length | 2,178 chars | n = 278 apps |
| Withdrawn | See correction above | |
| Withdrawn | See correction above |
* The subtitle rows above were withdrawn on September 1, 2026. See the correction at the top of this article.
The average title contained 24.1 characters. That is a description of the sample, not a target length: it does not establish that using more characters would improve a title. Before changing yours, decide whether a searcher can understand what the app does; then check the character limits.
The subtitle rows are a correction rather than a finding: this article originally reported that 61.2% of these apps had no subtitle. That number has been withdrawn — our iOS collector never captured the field, so it described our data collection and not the App Store. We have left the strikethrough above rather than quietly deleting the row.
Does editing your listing get you more reviews?
This corrected study does not answer that. The original review-growth comparison grouped apps by detected listing edits, but the collector could miss subtitle edits. We have removed that comparison rather than present those groups as "edited" and "static." Even a complete observational comparison would not isolate the effect of editing from releases, promotion, seasonality or other differences between apps.
How to use these observations in your own listing review
When reviewing your own listing, start by checking what the data actually captured. These steps can help organize that review, although we did not test their effect on rankings or installs.
1. Verify a missing field before fixing it. Open the live listing in the same storefront and language as your monitoring view. If a subtitle appears there but is blank in a report, investigate collection before rewriting copy. Our withdrawn subtitle finding is an example of why that check matters.
2. Review fields separately. This sample recorded release-note changes for 89 apps, description changes for 62, and title changes for 57. A recent release-note update does not tell you whether the title or description was reviewed. Compare each field with your current features and intended audience.
3. Make edits for a specific reason. A 24.1-character average title does not mean a longer title is better, and an unchanged listing is not automatically a poor listing. Write down the problem you are addressing — an unclear purpose, an obsolete feature claim, or wording that does not match the app — before changing it.
4. Keep the context alongside the change. Record the date, storefront, language, previous text and new text. If you compare later results, also note releases or promotions in the same period. Store monitoring can help preserve listing history; a change log alone cannot establish why rankings or installs moved.
Frequently Asked Questions
How often should you update your App Store listing?
This study does not establish an optimal schedule. In the original combined-field comparison, 141 of 202 apps with at least 14 days of coverage (69.8%) had no detected change in the recorded core fields. The collector did not capture iOS subtitles, so this is not evidence that 70% of complete listings were unchanged. Median per-app coverage was 23 days, and we did not measure whether a particular editing schedule improves rankings.
Do I need to update my app store listing if nothing changed in the app?
The snapshots cannot decide that for your app. We recorded release-note changes for 89 of 278 apps (358 events), description changes for 62 (173 events), and title changes for 57 (158 events). These groups can overlap, so the counts do not show that developers changed only release notes. We observe listing text, not builds, reasons for editing, or the effect on installs.
Does updating your app store listing hurt your rankings?
This dataset cannot answer that. We recorded listing edits but did not run a controlled comparison of rankings before and after those edits.
What percentage of apps use the App Store subtitle?
We have no reliable figure for subtitle usage. This article originally claimed that 61.2% of apps had no subtitle; that figure has been withdrawn. A later check showed our iOS collector never captured the subtitle field, so the number measured a gap in our own data rather than the App Store. See the correction at the top of this article.
How long is the average app description?
2,178 characters, measured from the latest snapshot of each of the 278 apps. Both stores allow up to 4,000, so the typical listing here uses a little over half the space available to it.
Can you see what keywords a competitor is targeting in their App Store keyword field?
Not from this public-listing dataset. Apple's keyword field was empty for all 278 apps in our corpus, so we make no claims about its contents or changes. Visible listing text and observed keyword ranks can support hypotheses about competitor targeting, but they do not reveal the private keyword field.
Published: August 10, 2026. Subtitle correction: September 1, 2026. Correction completed: September 10, 2026. The measurement window has not changed.
Methodology: 26,972 store-listing snapshots covering 278 apps monitored inside AppDrift between May 5 and August 10, 2026, yielding 20,816 successive-snapshot comparisons across 211 apps. These totals are not distinct app-days. Per-app coverage is a median of 23 days (mean 21.3); 96 apps have 30+ days and 3 have 60+. The original combined-field distribution uses 202 apps with 14 or more days of coverage and includes recorded title, subtitle and description values; iOS subtitles were not captured, so this distribution does not measure complete listing edit frequency. Subtitle usage, length and change counts are withdrawn. Apps are owner-added and skew small and independent — this is not a sample of top-charting apps. Aggregates are anonymised; no customer app is identified.