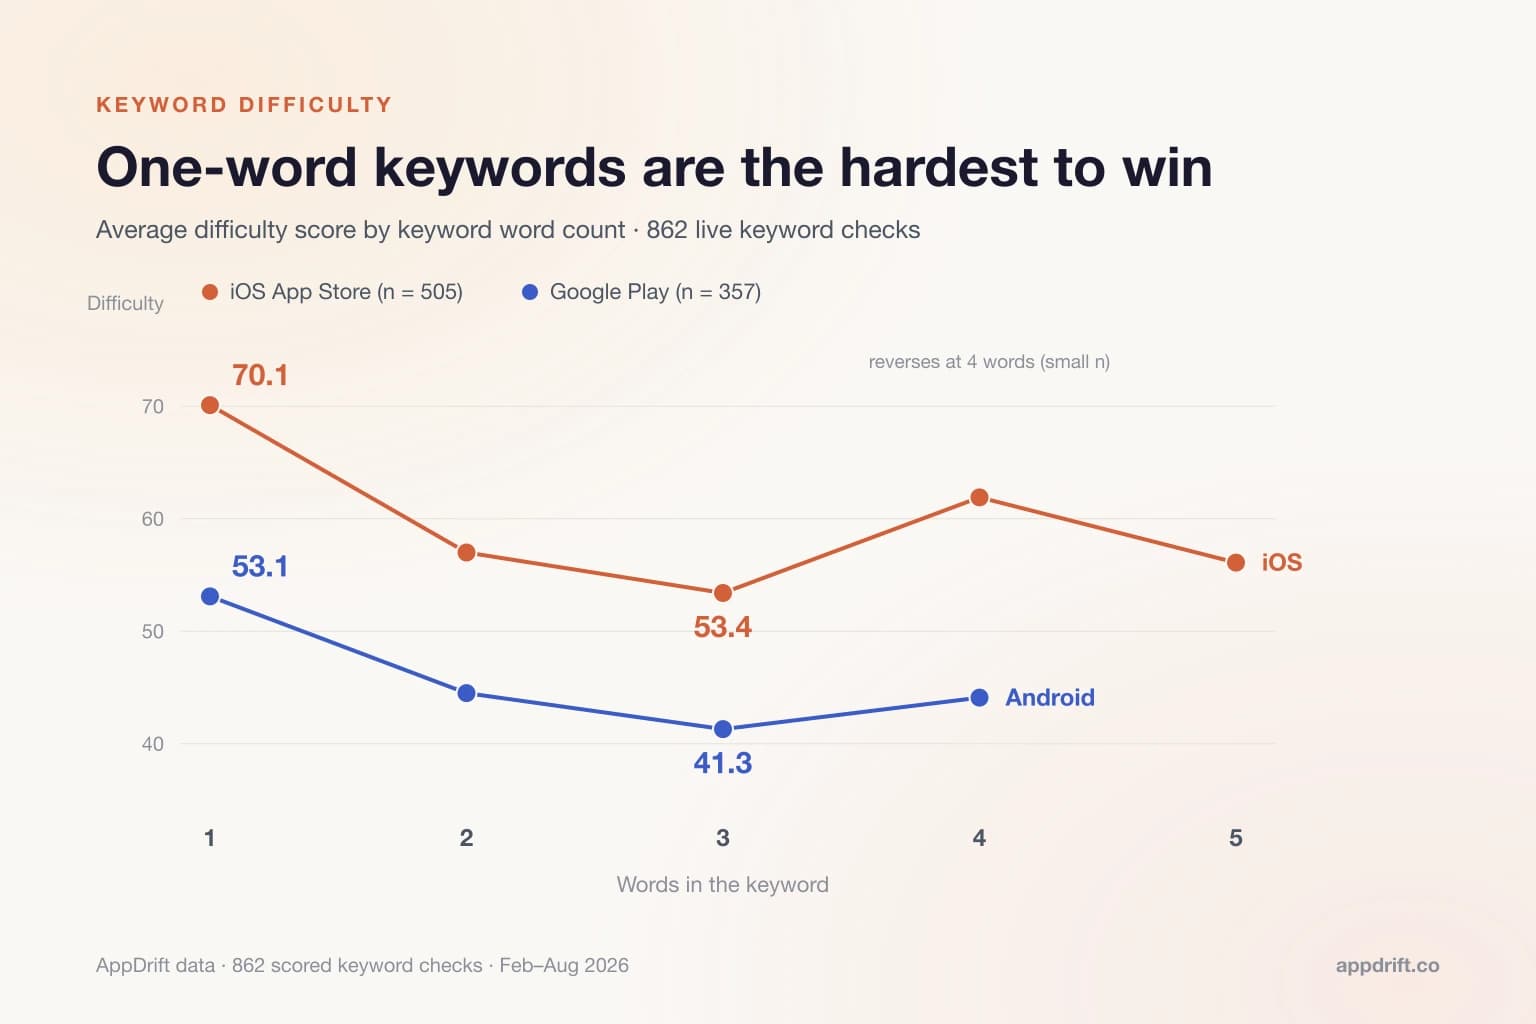
Quick answer: two- and three-word phrases had lower average difficulty scores than single words in this sample. Across 862 stored difficulty checks (505 iOS, 357 Google Play), one-word iOS keywords averaged 70.1 difficulty (n = 130) and two-word keywords averaged 57.0 (n = 222) — a 13.1-point gap — with three-word keywords at 53.4 (n = 101). Google Play traced the same shape: 53.1 → 44.5 → 41.3. At four words the pattern flattens and reverses on both stores, on samples too small to trust.
Correction — September 11, 2026: these are self-selected keyword checks, and “popularity” is a model proxy rather than measured keyword search demand. On iOS, review counts contribute to both popularity and 40% of difficulty, so their correlation is structurally coupled. We withdraw earlier claims that low-scoring keywords are unwanted and that a shallower total Android result list directly lowers difficulty when the same top ten are available. Counts, scores and screenshots are preserved.
Dataset through August 10, 2026; interpretation corrected September 11, 2026.
Keep the storefront alongside every comparison. Our public study of ratings across five countries shows how the same app can return different rating scores and counts in different storefronts; it does not measure keyword difficulty or explain its causes.
What counts as a long-tail app store keyword?
For this study, we group queries by word count. One-word queries are the head terms; two- and three-word queries are longer phrases. Word count gives us a consistent way to compare groups, but it does not tell us how often people search for a phrase.
We analyzed 862 stored checks from the model behind the keyword difficulty checker. The iOS group has 505 checks covering 469 distinct keywords in 10 country storefronts, with records starting February 20, 2026. Google Play has 357 checks covering 357 distinct keywords in two countries, starting March 9, 2026. The records are aggregated and anonymized. This expands the 604-check analysis published on August 2.
That origin is also the study's first limit. Nobody drew these keywords at random: they are terms developers typed in because they were already considering them, which skews the corpus toward independent apps and the niches they compete in. Everything below describes the keywords developers like you are evaluating — not the App Store as a whole, and not what the top charts are doing.
Do keywords with more words score easier?
In this corpus, yes — and the size of the gap is the finding. One caveat on how to read the table: these are averages of different keywords grouped by length, not the same keyword measured before and after a word was added. We can tell you that longer phrases scored lower; we cannot tell you that lengthening a specific phrase will lower its score. Every cell carries its sample size, because some are small and you should be able to see which:
| Words in keyword | iOS n | iOS avg difficulty | Android n | Android avg difficulty |
|---|---|---|---|---|
| 1 word | 130 | 70.1 | 109 | 53.1 |
| 2 words | 222 | 57.0 | 143 | 44.5 |
| 3 words | 101 | 53.4 | 82 | 41.3 |
| 4 words | 26 | 61.9 | 20 | 44.1 |
| 5 words | 18 | 56.1 | — | — |
The largest gap is between one- and two-word queries. On iOS, their average scores differ by 13.1 points; the two- to three-word difference is 3.6 points. On Google Play, those gaps are 8.6 and 3.2 points. The two-word groups are also the largest in each platform sample: 222 iOS checks and 143 Google Play checks.
Both difficulty scores use the top ten returned apps. The Android collector's shallower overall response limits deep-rank observation, but does not by itself explain a top-ten score gap. Unequal samples, incomplete fields and different popularity proxies limit platform comparisons. A model score is not a calibrated ranking probability.
Where does the pattern stop?
At four words, the average score rises again on both stores. These groups are smaller, so read the difference cautiously.
iOS four-word keywords averaged 61.9 difficulty (n = 26) — higher than both the three-word average (53.4) and the two-word average (57.0). Five-word iOS keywords came back to 56.1 (n = 18). Google Play four-word keywords averaged 44.1 (n = 20), also above their three-word figure of 41.3. The honest shape of this dataset is not a clean line sloping downward: it drops hard, flattens, then bends back up.
Read the longer groups cautiously. The four- and five-word cells are small — 26, 18 and 20 checks, against 222 for the two-word iOS cell — so the longer groups give us limited evidence, and those numbers could move with another few hundred checks. But the practical read is the same either way: two and three words is where the entire measured difference lives. Nothing here says a four- or five-word phrase scores easier still, so do not plan around the assumption that it will.
Do shorter keywords score harder, too?
We also grouped the same checks by character count. It is not independent evidence — more words almost always means more characters, so the two measures are largely re-describing the same keywords. Treat it as a consistency check, not a second confirmation. The same iOS checks, bucketed by character count:
| Keyword length | n | Avg iOS difficulty |
|---|---|---|
| 3–5 characters | 54 | 73.4 |
| 6–10 characters | 102 | 64.4 |
| 11–15 characters | 162 | 58.8 |
| 16–20 characters | 114 | 54.6 |
| 21–25 characters | 48 | 52.8 |
| 26–30 characters | 20 | 56.1 |
A three-to-five character query averages 73.4 — the hardest cell in the study. By 21 to 25 characters the average is 52.8, more than twenty points lower. Then, exactly as with word count, the last cell ticks back up: 26 to 30 characters averaged 56.1 on just 20 checks. Both cuts stop improving at roughly the same place. Because they are not independent measures, that agreement is internal consistency rather than corroboration — and the final cell rests on 20 checks, which makes it the single number here most likely to move as the corpus grows.
Why is the same keyword "Very hard" on iOS but only "Competitive" on Android?
Averages are abstract, so here is one keyword, one country, one day. We scored habit tracker on the US storefront of both stores on August 10, 2026:
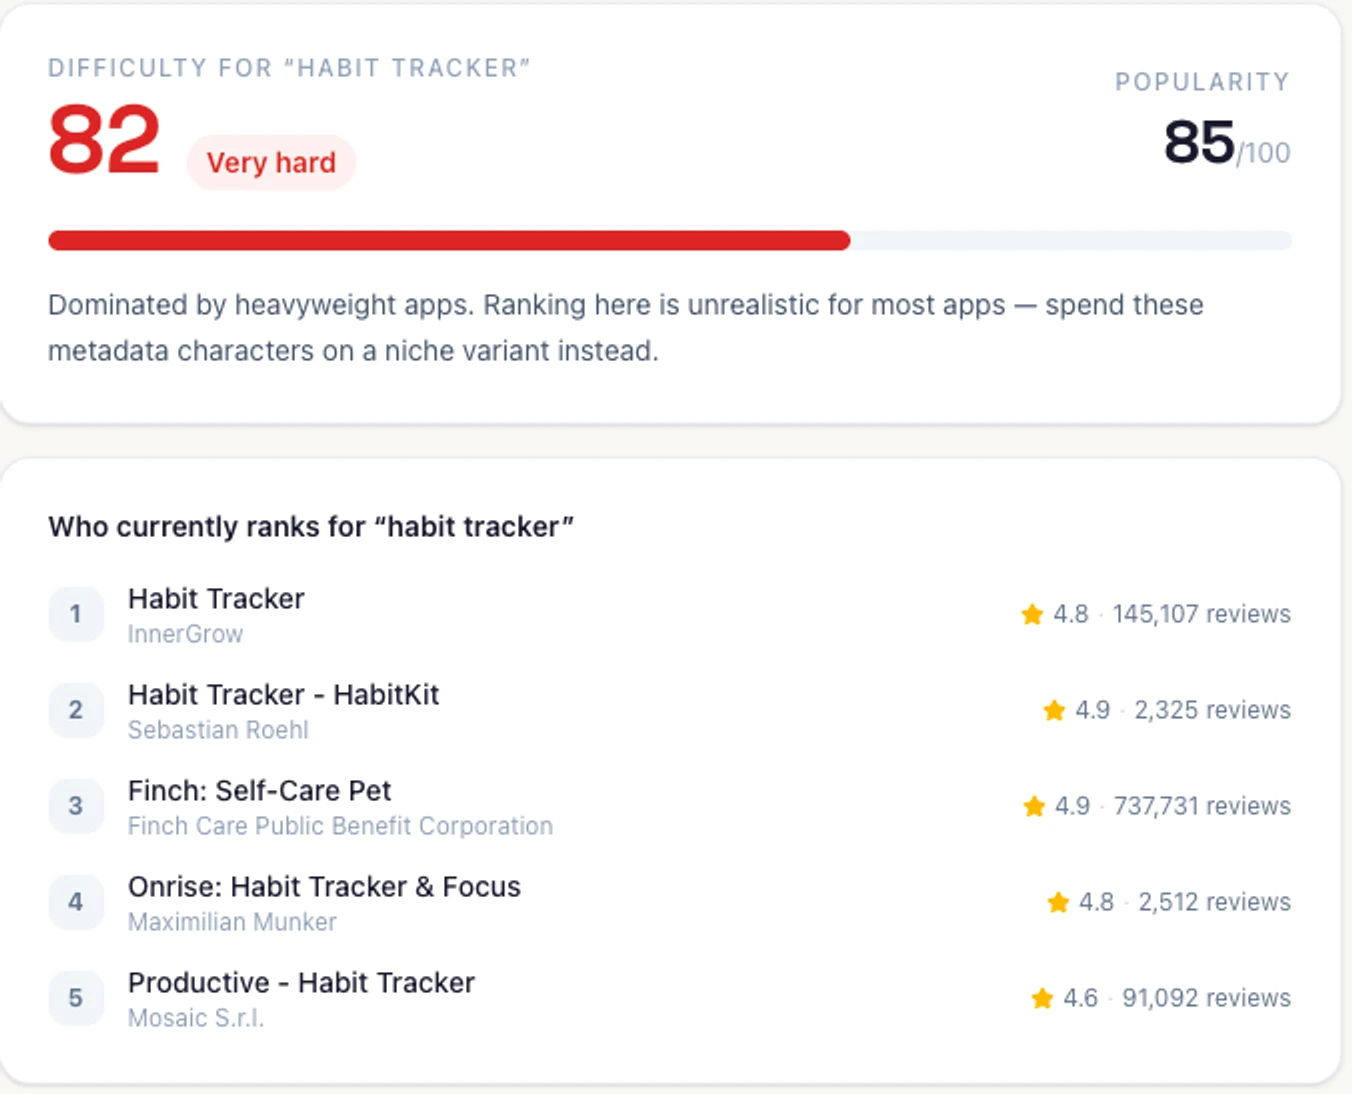
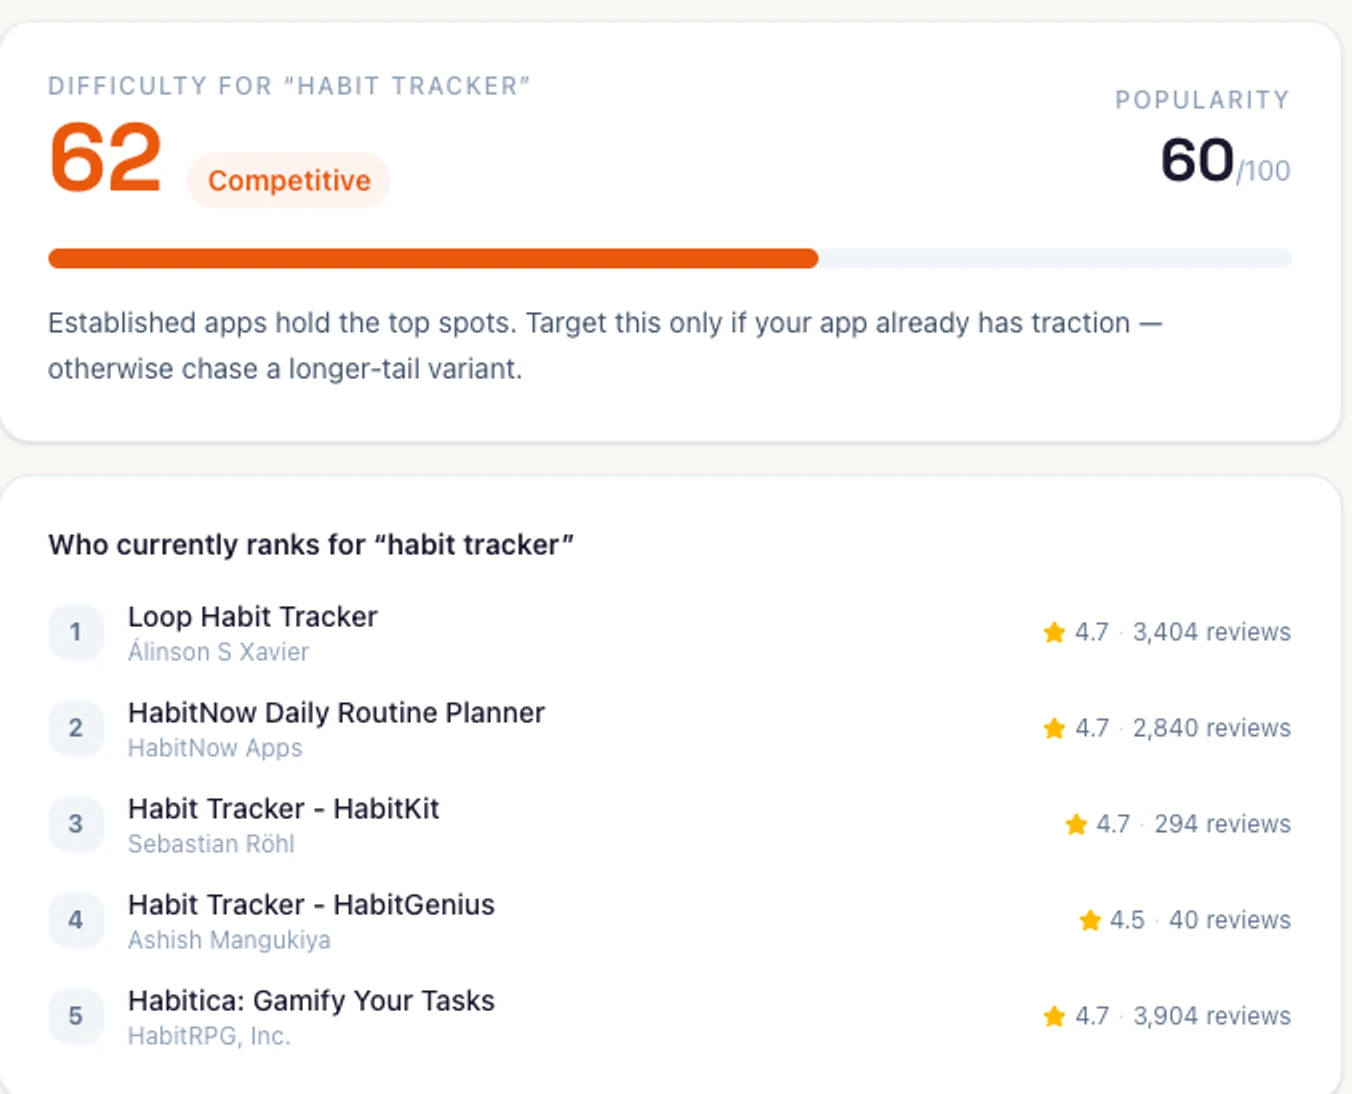
| "habit tracker", US, 2026-08-10 | iOS App Store | Google Play |
|---|---|---|
| Difficulty | 82 — Very hard | 62 — Competitive |
| Popularity | 85 / 100 | 60 / 100 |
| #1 result | Habit Tracker (InnerGrow) — 4.8, 145,107 reviews | Loop Habit Tracker (Álinson S Xavier) — 4.7, 3,404 reviews |
| #3 result | Finch: Self-Care Pet — 4.9, 737,731 reviews | Habit Tracker – HabitKit — 4.7, 294 reviews |
The screenshots retain the tool's original “reviews” labels. The adapters use different fields: the iOS count includes star ratings, while Android uses written reviews. Habit Tracker – HabitKit by Sebastian Röhl appears at #2 on iOS with a displayed count of 2,325 and #3 on Google Play with 294. Those counts describe different kinds of feedback, so their ratio cannot establish a difference in audience size or ranking effort.
The 82-versus-62 comparison is a model result for that query and date, not an estimate of relative ranking effort. Both difficulty scores use the top ten returned apps. A roughly 25–30-result collector window limits deep rank observation, but does not by itself explain a top-ten score difference when both responses include ten results. Nor does it mean Play users can see only 30 apps. The earlier 604-check study has a different, uneven platform sample.
Why do difficulty and popularity scores correlate?
Difficulty and popularity correlate at r = 0.771 on iOS (n = 505) and r = 0.505 on Google Play (n = 357). These are correlations between model outputs. On iOS both use top-ten review counts, and review strength contributes 40% of difficulty. Because the formulas share this input, some relationship between the scores is built in. We have not measured how much it explains.
No independent keyword search-volume or conversion measure validates demand in this corpus. A low popularity score therefore cannot establish that nobody searches a phrase. Likewise, a high score does not prove that relevant users will install your app. Review independent demand evidence when available and keep it separate from these proxies.
How many keywords actually pass both filters?
We applied an illustrative pair of score thresholds — difficulty under 40 and popularity at 40 or above — and counted the records passing both:
- iOS: 18 of 505 checks — 3.6%.
- Google Play: 79 of 357 checks — 22.1%.
Those pass rates describe two uneven samples under platform-specific popularity formulas. They are not the share of keywords that are “winnable and wanted,” nor an expected success rate for another app. The current difficulty calculation uses the first ten results: keeping them fixed while changing total depth from 30 to 200 leaves difficulty unchanged; the popularity formula separately includes a result-count bonus.
Zero checks on either platform scored at least 70 on difficulty while scoring below 30 on popularity. That is an empty region of these model outputs, not evidence that hard-but-unwanted keywords do not exist. Shared score inputs can shape the distribution; this study does not quantify the contribution of each input.
Are long-tail keywords easier outside the US?
The non-US samples are too small to answer that. The US is the only storefront with a real sample: 403 iOS checks averaging 61.9 difficulty, 356 Android checks averaging 46.3. Every other cell is tiny, and every one of them is iOS — Canada 60.5 (n = 18), Great Britain 59.5 (n = 17), Germany 52.0 (n = 14), France 49.8 (n = 14), Brazil 49.3 (n = 11), Japan 51.7 (n = 9), Spain 40.9 (n = 8), Australia 43.0 (n = 8). Every non-US cell has fewer than 20 checks behind it, and Google Play is effectively US-only here: 356 of its 357 checks are the US storefront, so we have nothing to say about international Play difficulty at all. Read that list as a hint worth testing on your own keywords, not a finding to act on.
So how do you find easy app store keywords for your app?
Use the findings to organize a shortlist for further review.
1. Score the two- and three-word variant of every head term before you commit a character. That is where the 13.1-point and 3.6-point gaps sit in our data, and checking a candidate costs you one lookup instead of a release cycle. You can score the two- and three-word variant yourself free, on either platform, in ten countries.
2. Compare several relevant variants. Feed the head term into a tool that will generate longer-tail variants of a head term from live store autocomplete, then score the shortlist. The full process — seed selection, autocomplete harvesting, mapping keywords to metadata fields — is a different job than this article and is covered end to end in the full keyword research workflow.
3. Keep proxy scores separate from demand. Record difficulty and popularity as screening inputs, then inspect the returned apps and the relevance of the query. Look for independent evidence such as available store-console query data or a carefully measured campaign. The 18-of-505 and 79-of-357 filter results are descriptive examples, not validated targeting rules.
4. Use the phrase that matches the task. If a four- or five-word phrase is genuinely how your users describe the problem, use it — because it is accurate, not because you expect it to be easier. Our data does not support that expectation.
Methodology and limitations
The corpus contains 862 stored scored checks: 505 iOS (469 distinct keywords, 10 countries, from February 20, 2026) and 357 Android (357 distinct, 2 countries, from March 9, 2026). The current model combines the top-ten review strength, rating quality, title match and publisher diversity into difficulty. The public checker can serve a cache within 72 hours and fall back to older cached results if collection fails. We have not established a fresh fetch timestamp for every historical check or verified that each used the current scorer version; “check” does not mean an independent live scrape.
The sample is self-selected, not random. These are keywords AppDrift users chose to check because they were considering them — a demand-driven sample skewed toward independent developers and the niches they build in, not a random draw from everything people search. It describes the keywords developers like you are evaluating, not the store as a whole.
Both difficulty scores use the top ten returned apps. The Android collector's shallower overall response limits deep-rank observation, but does not by itself explain a top-ten score gap. Unequal samples, incomplete fields and different popularity proxies limit platform comparisons. A model score is not a calibrated ranking probability.
Popularity is a coupled proxy, not a demand measure. Android uses install signals and iOS uses review counts; both formulas include model assumptions. On iOS, shared review inputs also contribute 40% of difficulty. The reported correlations are descriptive, not an independent validation of search demand. Existing screenshot labels such as “Popularity,” “Competitive” and “Very hard” name model outputs rather than measured volume or ranking odds.
Small cells are directional only. The four-word (n = 26 iOS, n = 20 Android), five-word (n = 18 iOS) and 26–30 character (n = 20) cells, plus every non-US country row, are all under 30 observations. We report them because hiding them would misrepresent the shape of the data — but they are hints, not findings.
Frequently asked questions
What are long-tail keywords in this study?
We grouped phrases by word count: one-word head terms, then two-, three-, four- and five-word groups. Word count is not a measure of demand or relevance.
Did longer phrases receive lower difficulty scores?
In this selected sample, iOS averages were 70.1 for one word, 57.0 for two and 53.4 for three; Android averages were 53.1, 44.5 and 41.3. The pattern reversed at four words in smaller groups. These compare different phrases rather than the effect of lengthening one phrase.
Do these scores identify keywords with low competition and high demand?
No. Difficulty and popularity are model outputs. On iOS both use review counts, which creates structural coupling; neither independently measures keyword search volume or install conversion.
Does a 30-result Android response directly reduce top-ten difficulty?
Not when the same first ten apps are present. The current difficulty scorer uses only the first ten. Total result depth affects observation coverage and a separate popularity bonus, while missing top-ten fields can affect difficulty inputs.
How should I use the findings?
Generate relevant phrase variants, inspect their returned apps and use scores as screening inputs. Assess demand separately where evidence exists, then monitor actual results. No word count or score threshold guarantees rankability.
Methodology note: 862 keyword difficulty checks (505 iOS, 357 Google Play) scored from collected store search results, February 20 – August 10, 2026, across 10 iOS country storefronts and 2 on Google Play. Sample is demand-driven and self-selected; The collector's shallow Google Play response limits rank observation; platform scores also use different samples and popularity proxies, so they should not be treated as comparable ranking probabilities. Averages as computed, not re-rounded. Dataset aggregates are anonymized; no customer app data is disclosed.