Quick answer: In an August 2026 analysis of 604 scored keyword checks (580 distinct keywords, 9 countries, February–August 2026), the average keyword difficulty on the iOS App Store was 61.7/100 versus 44.1/100 on Google Play — a 17.6-point model-score gap. The point difference does not tell us how much harder either store is to rank in. Not one of the 193 Android keywords scored above 73, while 27 iOS keywords scored 81 or higher.
Correction — September 11, 2026: the original relative-competitiveness claim is withdrawn. A ratio of composite model scores does not measure how much harder it is to rank. The 604 stored checks use uneven, selected keyword samples and differing field coverage. Their counts and charts remain descriptive; a check record does not establish a fresh fetch on every invocation.
Model-score distributions by platform
| Platform | Keywords scored | Avg difficulty | Median | Std dev | Hardest scored |
|---|---|---|---|---|---|
| iOS App Store | 411 | 61.7 | 62 | 12.8 | 94 |
| Google Play | 193 | 44.1 | 43 | 10.9 | 73 |
In the US-only subset, iOS averaged 63.8 (n=325) and Android 44.1 (n=192), a 19.7-point gap. Overall medians were 62 and 43. These are score summaries for the selected checks, not estimates of the effort needed to rank.
The distribution says it better than the average
In the sample, 55% of iOS checks scored 61 or above; fewer than 10% of Android checks did. The 41–60 band contained 37% of iOS and 52% of Android checks. Labels such as “hard” or “competitive” group the model’s scores; they do not give the odds of reaching a rank.
None of the 193 Android checks scored above 80; 27 iOS checks did. The highest Android score in this corpus was 73 for “vpn.” These maxima describe the selected records, not the hardest keyword ever available on either platform.
What the hardest and easiest keywords look like
The individual queries show what the score range looks like. These are the hardest scored keywords per platform (all US storefront; brand names and app-specific terms excluded from the easy lists):
| # | iOS keyword | Difficulty | Android keyword | Difficulty |
|---|---|---|---|---|
| 1 | rent | 94 | vpn | 73 |
| 2 | sleep | 90 | recorder | 72 |
| 3 | calendar | 88 | wallpaper | 69 |
| 4 | journal | 88 | receipt | 68 |
| 5 | budget | 87 | ai video generator | 67 |
| 6 | recipe | 87 | download | 65 |
Notice that Android's #1 hardest keyword would rank below iOS's #6. Notice also what the iOS list is made of: plain English nouns. On the 2026 App Store, the generic single words at the top of the table — sleep, calendar, journal, budget, recipe — all scored 87 or higher, with top tens dominated by long-established apps. Even the two-word combinations developers consider "long-tail" often are not: "habit tracker" scored 84 and "music player" 83.
At the other end, the easiest scored keywords that still return real competition:
| iOS keyword (easiest) | Difficulty | Android keyword (easiest) | Difficulty |
|---|---|---|---|
| warranty tracking | 30 | cash flow forecast | 24 |
| scam text detector | 31 | spain national team | 26 |
| fitness testing (CA) | 33 | outdoor water sources | 30 |
| scam alerts | 35 | trail water report | 30 |
In the smaller non-English cells, a French food-expiry query scored 25/100 with 10 returned apps, while some Spanish, Portuguese and German niche phrases scored 25–36. These are selected examples, not evidence that localized markets are generally easier. Our 123-app scorecard study measures a separate listing-check sample and cannot validate that inference.
What could explain the model-score gap?
The current difficulty scorer applies the same four components to each platform. Differences in the sampled keywords and available fields may affect the scores. We did not measure each factor’s contribution or verify every historical scorer version.
1. Review counts contribute to the model. Review strength accounts for 40% of difficulty. Differences in retrieved review counts can change that component; this study does not establish that all generic iOS queries have larger incumbents than comparable Play queries.
2. Metadata and input coverage differ. The stores expose different listing fields, and the collector enriches their results differently. This analysis does not isolate a causal algorithm explanation for the score gap.
3. The samples do not isolate the cause. Different chosen keywords, returned results and platform signals can affect the model. We did not run an experiment that attributes the score gap to Google or Apple algorithm weights.
Input coverage matters. The inspected collector enriches only the first five Android results with full details. Missing review data in positions six through ten can affect a score that treats missing counts as zero. This is separate from total result depth: both difficulty calculations use the first ten returned apps, so a 30-versus-200 result list does not directly change difficulty when those first ten are unchanged.
The Android limitation: the collector returned fewer results
Our collector returned a median of 30 Google Play results, with 80% of checks returning 35 or fewer; the iOS median was 200. That is a collection-depth limitation, not a claim that every user can see only 30 Play results. An app absent from the response is outside our observed range or otherwise not returned by that check; we cannot assign it rank 31 or call it invisible to all users. See how to interpret store rank checks before comparing platforms.
What this means for your keyword strategy
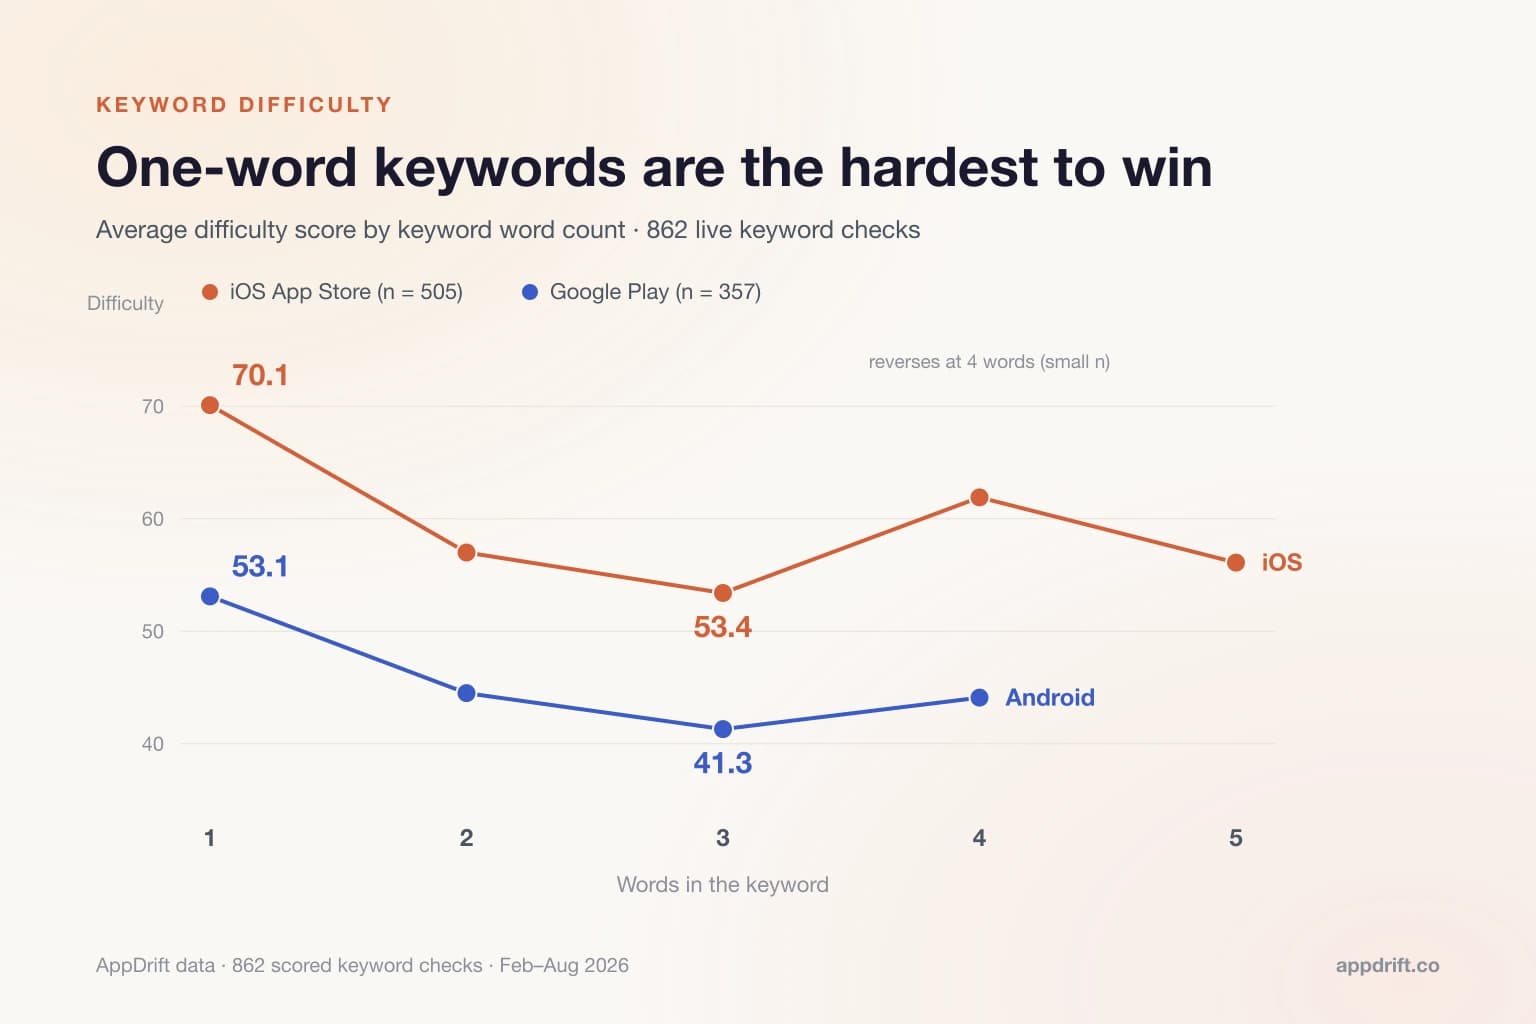
The later 862-check phrase-length study reports iOS averages of 70.1, 57.0 and 53.4 for one-, two- and three-word phrases. It compares different selected phrases, not the causal effect of lengthening a keyword. Its popularity/difficulty correlation uses coupled model inputs and does not measure demand.
If you are on iOS: review the relevance and returned competitors for each candidate. In this sample, 37% of iOS checks scored 41–60, but no threshold guarantees that a new app can rank. A lower score is a screening input, not a substitute for product fit and actual monitoring.
If you are on Android: review each keyword's actual results and product relevance. The sample's 41–60 scores and maximum of 73 do not establish your app's bottleneck or a guaranteed route to rank. Metadata generation can prepare wording for reviewed choices, but does not replace those checks.
If you're on both: don't copy your keyword set across platforms. The same keyword can return different competitors — in the three cases in our dataset where the identical keyword+country was scored on both stores, iOS came out harder every time (by 4 to 30 points; n=3, too few matches for a general conclusion). Research each store separately, and re-check quarterly: difficulty moves as top tens change. Use keyword tracking to maintain observations; a changed score does not prove a keyword has become winnable.
Methodology and limitations
The current difficulty score is computed from the first ten collected results for a keyword and storefront. A public-tool request may reuse a cache for up to 72 hours or fall back to older cached results after a collection failure; fresh fetches for all historical records have not been established. The model weighs four inputs: review strength (40%) — the log-scaled average review count of the top ten; rating quality (20%) — their average star rating; title match (20%) — how many of the top ten carry the keyword in their title; and publisher diversity (20%) — how many distinct developers hold those ten slots. The output is 0–100; the same code scores both platforms. Data: 604 scored checks (411 iOS, 193 Android; 580 distinct keywords) collected February 20 – August 2, 2026 across 9 country storefronts, generated by real usage of our keyword tools rather than a curated keyword list.
The sample contains keywords our users chose to check, with a concentration in indie-app categories such as utilities, trackers, and wallpapers. It does not represent store-wide search volume. The platform mix is uneven (68% iOS), and nearly all Android checks are from the US storefront. Every country group outside the US has fewer than 20 scored keywords, so we report only the US comparison. Popularity scores use different inputs on each store: Android installs and iOS review counts. We therefore keep those scores separate across platforms.
Frequently asked questions
Is it harder to rank on the App Store or Google Play?
This study cannot establish that. The selected iOS sample averaged 61.7 and the Android sample 44.1 under the model, but the keyword samples and field coverage differ. The 17.6-point gap is not relative ranking effort.
What score should I target?
Use scores to screen relevant candidates and inspect the underlying results. There is no score threshold that guarantees rankability, and popularity is not independent search-volume evidence.
How does the model calculate difficulty?
The current model uses the first ten returned apps: review strength contributes 40%, average rating 20%, title match 20% and publisher diversity 20%. Collection gaps and cached inputs affect interpretation; not every check proves a fresh live fetch.
Does the shorter Android result list explain its lower difficulty?
Not directly when the first ten results are unchanged. The difficulty scorer uses the first ten. Total result depth limits observed positions, while missing fields within those ten can change score inputs.
Methodology note: 604 keyword difficulty checks (411 iOS, 193 Android) scored from collected store search results, February 20 – August 2, 2026, across 9 countries. Sample is demand-driven and skews US (86%). Averages rounded to one decimal, shares to whole percentages. Dataset aggregates are anonymized; no customer app data is disclosed.