Quick answer: in this sample, a tracked iOS rank moved an average of 9.48 positions between consecutive days. The median move was 1 position, and top-10 ranks were unchanged on 72.5% of observed days. The study covers 13,220 daily rank observations across 452 tracked keyword series on both stores, from February 16 to August 10, 2026. Lower iOS ranks moved more: positions 51 and below averaged a 21.74-position daily change.
A 15-position drop can look alarming without a history to compare it with. We measured nearly six months of AppDrift rank history to see how often those moves occurred. The results describe the movement we recorded; they do not identify its causes.
Interpretation corrected September 11, 2026. This is a self-selected sample of tracked keyword series. The collector often returned a shallow Android response, but exact result depth and causes of missingness were not retained for every record. A missing numeric rank does not prove a position below 30, delisting or matching-storefront unavailability. The original counts and paired-rank calculations remain unchanged.
If your tracker shows no numeric position at all, use our missing-rank diagnosis with fresh tracking data before treating the gap as a movement. That article separates missing observations from storefront and listing checks.
How much do App Store rankings actually move in a day?
We collected 13,220 daily rank observations across 452 tracked keyword series between February 16 and August 10, 2026. The iOS sample contains 9,015 observations across 321 series; Android has 4,205 across 131. To measure daily movement, we compared recorded ranks on consecutive calendar days. That left 2,815 iOS pairs and 1,073 Android pairs.
| Platform | Day pairs | Unchanged | Avg abs move | Median | P90 | Moved 10+ |
|---|---|---|---|---|---|---|
| iOS App Store | 2,815 | 1,009 (35.8%) | 9.48 | 1 | 28 | 591 (21.0%) |
| Google Play | 1,073 | 866 (80.7%) | 0.58 | 0 | 1 | 16 (1.5%) |
The mean and median tell different parts of the story. The median move was just 1 position, but large jumps and falls pulled the average up to 9.48. Of the iOS day-pairs, 35.8% showed no change and 591 (21.0%) moved by 10 or more positions. The 90th percentile was 28 positions, meaning about nine in ten moves were that size or smaller.
Why does Google Play look so much calmer — and why that number is misleading
The two stores have different collection coverage, so their movement figures are not directly comparable. We could only calculate a move when both daily checks returned a numeric rank. We do not know why every missing Android rank was absent, or how much those gaps affected the average.
Among the 1,073 Android day-pairs we could compare, ranks moved an average of 0.58 positions. They were unchanged 80.7% of the time and moved 10 or more positions on 16 occasions. These recorded positions were relatively stable; missing observations prevent us from extending that conclusion to all Play results.
Does rank volatility depend on where you rank?
Yes, in this sample. When we grouped iOS pairs by their starting rank, lower positions had larger daily moves. That pattern does not explain why they moved more.
| Platform | Rank band | Day pairs | Avg abs daily move | % unchanged |
|---|---|---|---|---|
| iOS | 1–10 | 1,193 | 0.73 | 72.5% |
| iOS | 11–25 | 369 | 9.17 | 17.6% |
| iOS | 26–50 | 397 | 9.62 | 9.3% |
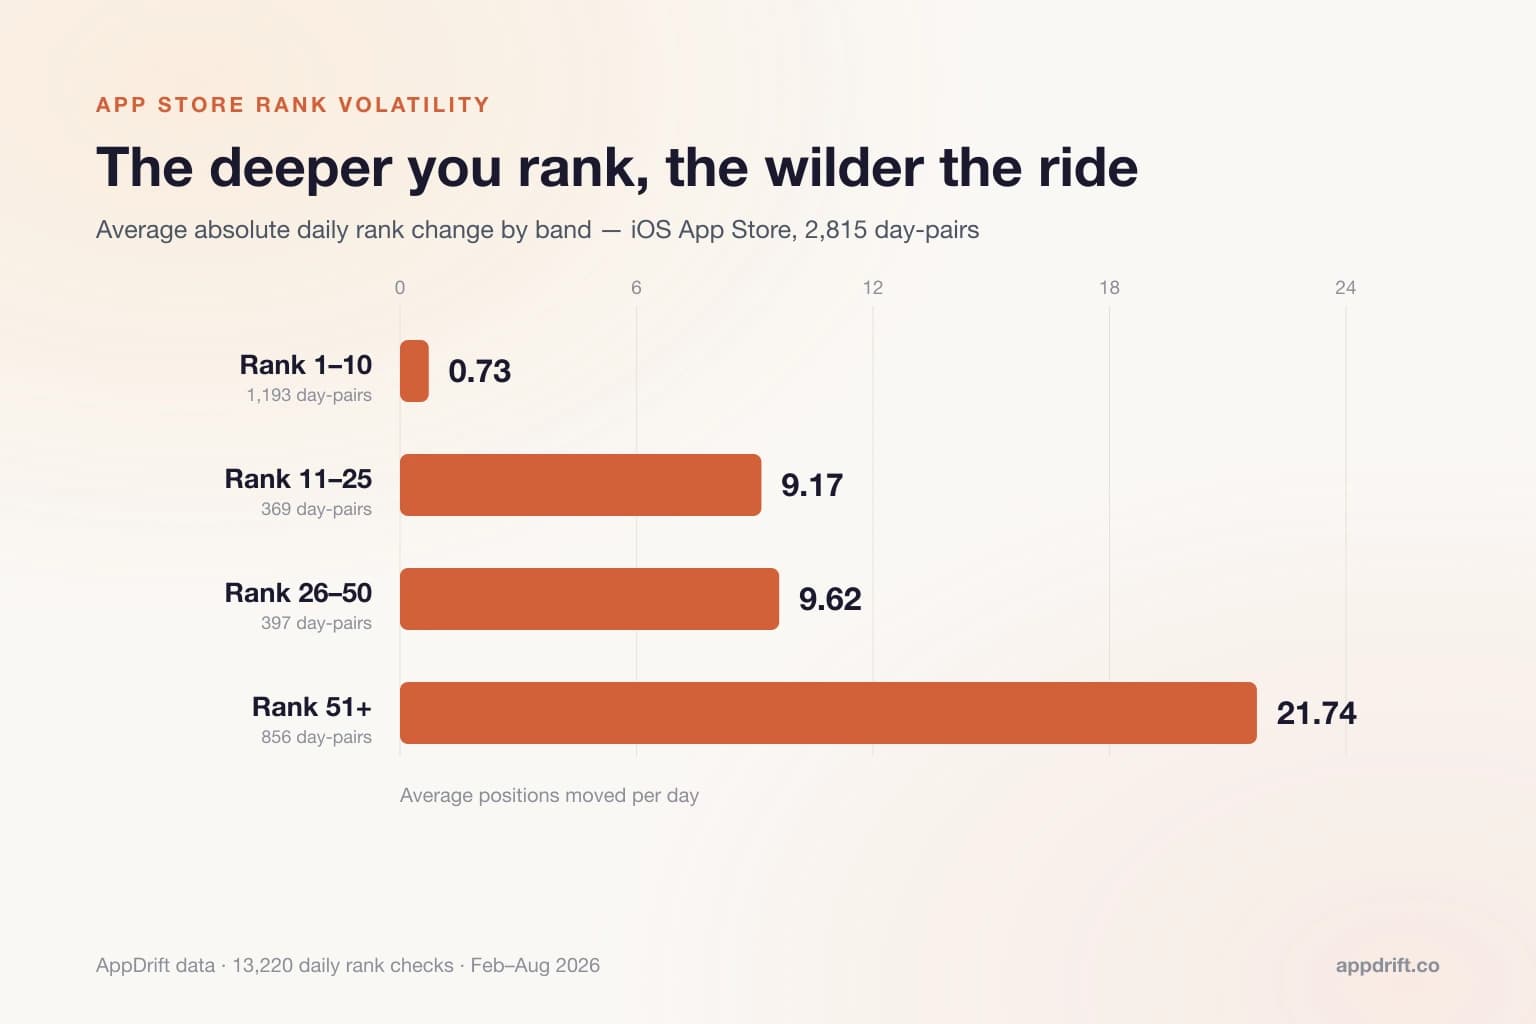
| iOS | 51+ | 856 | 21.74 | 4.9% |
| Android | 1–10 | 927 | 0.34 | 87.6% |
| Android | 11–25 | 118 | 1.87 | 39.0% |
| Android | 26–50 | 24 | 3.29 | 33.3% |
| Android | 51+ | 4 | — | — |
On iOS the top 10 is a different weather system from everything below it: 0.73 positions of average daily movement (n = 1,193) against 21.74 at rank 51+ (n = 856). The middle bands are nearly identical to each other — 9.17 at ranks 11–25 and 9.62 at 26–50 — so in this sample the line that separates stable from unstable is not "page one vs page two" but "top 10 vs not top 10."
The deeper Android groups are sparse: 24 day-pairs at ranks 26–50 and only 4 at 51+, which is why the latter mean is withheld. Those recorded deeper ranks also make a universal “nothing below 30” interpretation inappropriate. The 11–25 group recorded a mean movement of 1.87 positions and 39.0% unchanged. The 604-check score study has its own separate sample and collection limits.
Is a top-10 ranking actually safe?
Calm is not the same as permanent. Across the panel we observed 1,273 iOS days where a tracked keyword sat inside the top 10; those produced 56 exits from the top 10 and 65 entries into it. On Android there were 1,042 top-10 days, 48 exits, and 15 entries.
So a top-10 iOS position stayed put on 72.5% of observed days and still fell out of the top 10 on 56 occasions across the February–August window. That combination is the measurement trap: when a band barely moves, the one day it does move is easy to miss if you sample irregularly. The positions you most want to hold are also the quietest ones in the data, so a change there stands out against a much smaller background of routine movement than the same change at rank 60 would.
How much do rankings drift week over week?
We also calculated a weekly average for each series, then compared consecutive weeks. The table separates the size of each move from its direction.
| Platform | Week pairs | Avg ABSOLUTE weekly move | Avg NET drift |
|---|---|---|---|
| iOS App Store | 666 | 16.45 | −1.92 |
| Google Play | 264 | 1.96 | +0.89 |
The size of weekly moves was much larger than the net drift. Gains and losses partly cancel when averaged together, which can hide trends in individual keywords. Look at both measures and each keyword’s history when reviewing an app.
My app dropped 15 positions overnight — should I panic?
A 15-position drop at depth deserves context before you attribute it to a specific cause. In the sample, 21.0% of all iOS day-pairs moved at least 10 positions and the rank-51+ mean absolute movement was 21.74. Those summaries do not rule out a real product, metadata or collection issue in an individual case.
If you were inside the top 10, the same drop means something quite different. Top-10 ranks moved 0.73 positions on an average day and were unchanged 72.5% of the time, so a double-digit move out of that band is a genuine outlier — one of the 56 exits, not routine churn.
Either way the correct response is the same: read the trend line across several weeks, while checking the individual result and any collection issue. To establish where you actually stand before reading anything into a movement, you can check where your app ranks right now for free. Inspect the returned position and neighboring apps alongside its collection status; a missing value does not establish why the app was not returned:
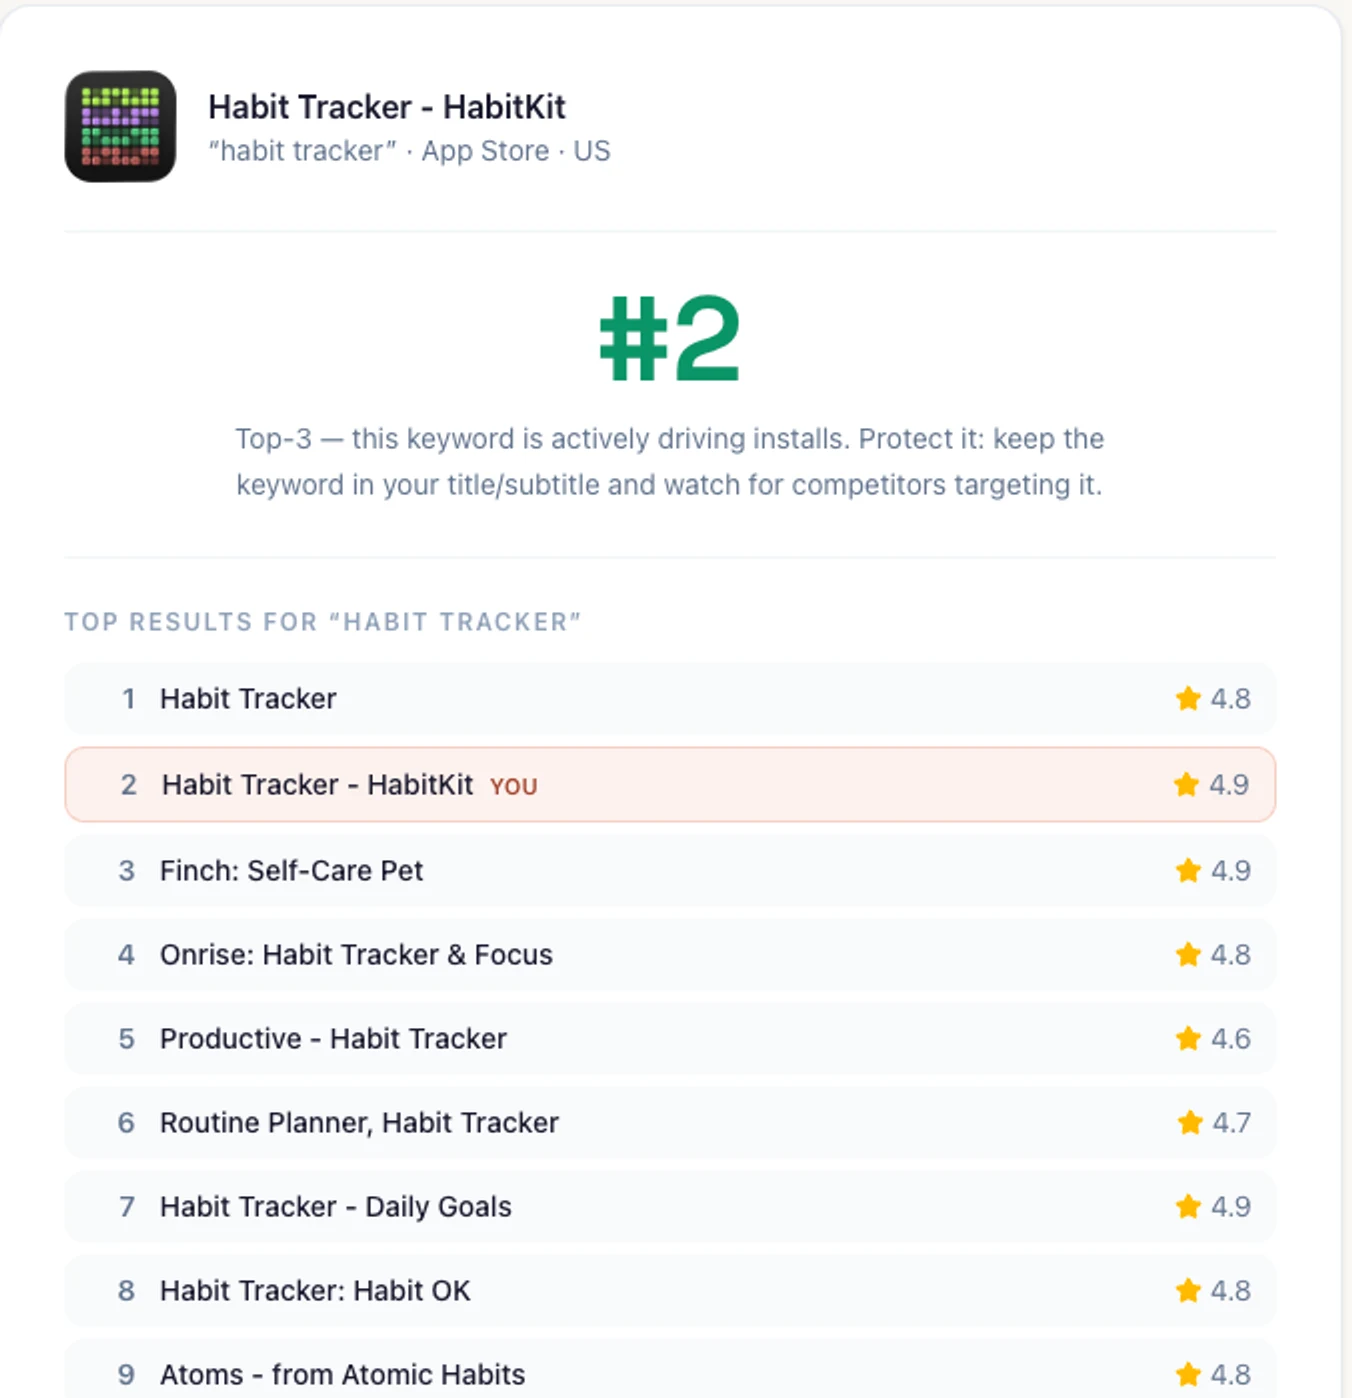
That single check is a snapshot, though — the same limitation this whole study is about. One reading tells you today's position; only a series tells you whether it is moving.
As for cause, this study deliberately makes none of those claims. If you want to explore whether store-level changes were in play during a given period, we keep a separate running log of the confirmed 2026 store algorithm changes.
How often does a tracked keyword rank at all?
Most daily checks in this panel returned no numeric rank. We count checks here, so a keyword that appeared on some days and was missing on others contributes to both groups.
| Platform | Observations | % ranked at all | % in top 10 | % in top 3 |
|---|---|---|---|---|
| iOS App Store | 9,015 | 37.2% | 14.8% | 8.9% |
| Google Play | 4,205 | 30.2% | 25.4% | 19.7% |
On iOS, 37.2% of 9,015 observations returned a rank; 14.8% were top 10 and 8.9% top 3. On Android, 25.4% were top 10 versus 30.2% with any numeric rank. The Android response is shallow, so these are censored observations, not evidence that Play users see only 30 results or that Android apps generally rank higher. The keyword difficulty checker can help screen relevance and competition, but its score does not remove collection limits.
What this means for how you measure rankings
Use these findings to plan how you review rankings:
1. Sample daily, not weekly. A weekly check hands you one draw from a distribution whose average absolute swing is 16.45 positions and whose net drift is −1.92. You cannot separate those two with one sample a week.
2. Set your alarm threshold by rank band, not globally. Outside the top 10, a 10-position move needs context before it triggers a major response — it happened on 21.0% of iOS day-pairs. Inside the top 10, where the average move is 0.73 positions, even a modest slide deserves a look.
3. Judge every change on a multi-week trend, never on a day. A single day at rank 51+ carried 21.74 positions of average movement all on its own. A sustained trend warrants investigation; neither duration nor a single observation establishes cause.
4. Watch your top-10 keywords more closely than your deep ones. That is where 56 exits happened against a near-flat background, so a movement there is far easier to distinguish from routine noise than one at depth.
5. Audit the keywords you never surface for. Only 37.2% of iOS observations returned a rank at all. That is an observation-level figure, not a keyword-level one — we did not measure how many individual keywords never ranked once — but it does mean the majority of daily checks in this panel came back empty, which is worth auditing if your slots are limited.
A consistent daily history makes these comparisons easier. AppDrift's current Free plan includes daily tracking for five keywords, with no trial clock attached. Start with the five terms most relevant to your app and build a history you can refer to when something changes.
When you edit your metadata, compare later observations with that baseline using ASO Autopilot's 14-day before/after impact reports on every metadata change.
Methodology and limitations
The dataset includes every daily rank observation stored by AppDrift's tracker between February 16 and August 10, 2026: 13,220 observations across 452 keyword series. iOS accounts for 9,015 observations and 321 series; Android accounts for 4,205 and 131. Daily calculations compare consecutive calendar days only, yielding 2,815 iOS pairs and 1,073 Android pairs. A gap in a series contributes no daily pair. Weekly calculations compare each series' average rank with the previous week, giving 666 iOS and 264 Android week-pairs. The aggregates are anonymized and identify no customer app.
What this data cannot tell you. Four limits, stated plainly:
It is a self-selected sample. These are keywords AppDrift users chose to track, not a random sample of either store, and the apps behind them skew indie and small-team. We have not characterised the category mix, so we cannot say how representative it is. Store-wide volatility, and volatility for large publishers in particular, could look nothing like this.
Missing ranks are censored observations. Exact response depth and reasons for absence were not retained per record. Do not replace missing values with rank 31 or infer delisting; check the relevant storefront and record what is observable. The Android movement summaries use observed rank pairs and cannot describe unobserved movement.
"Unchanged" means consecutive calendar days. A series that skips a day contributes no pair for that gap, so the unchanged percentages describe day-to-day stability, not week-long stability.
We did not identify the causes of movement. The data shows how far ranks moved, but cannot separate the effects of algorithm updates, competitors, reviews or metadata edits.
Frequently asked questions
How often did iOS ranks change in this sample?
Of 2,815 consecutive-day iOS pairs, 64.2% changed by at least one position and 35.8% were unchanged. Median absolute movement was 1 position and the mean was 9.48. These describe observed pairs in a selected panel.
Can a one-day drop identify its cause?
No. It may reflect a real change, ordinary movement or collection differences. Inspect the underlying storefront result, data quality and multi-day context before attributing it to an algorithm or metadata edit.
Were top-ten ranks more stable?
In the recorded iOS top-ten pairs, 72.5% were unchanged and mean absolute movement was 0.73 positions. That is a descriptive sample result, not a guarantee that a current top-ten rank will persist.
Does a missing Android rank mean the app is below position 30 or delisted?
No. Exact response depth and causes of missingness were not retained for every observation. Missing values cannot be assigned a numeric position or used alone to infer delisting or storefront unavailability. Cross-platform movement comparisons are limited by which ranks were observed.
Methodology note: 13,220 daily rank observations across 452 tracked keyword series (iOS 9,015 / Android 4,205), February 16 – August 10, 2026. Day-over-day figures use consecutive-calendar-day pairs only. Sample is self-selected from keywords AppDrift users chose to track and skews indie. Google Play observations are limited by collection coverage; exact depth and missingness causes were not retained per observation, so absent values cannot be assigned a rank or treated as delisting. Averages rounded to two decimals, shares to one. Aggregates are anonymized; no customer app data is disclosed. Last updated: August 10, 2026.